Fun with JTAG
As I mentioned previously, I am working on adding an officially supported CDT integration with gdb that can be used with JTAG hardware debugging devices. As a quick primer, JTAG devices allow you to have full control over the CPU and memory on a embedded computing board using a special connector that is now pretty much standard on all such boards. With debugging support, that means you can read and write memory and any memory mapped registers, read and write CPU registers, and set breakpoints. A lot of the JTAG vendors are starting to support integration of their devices with gdb as a front end to give developers a familiar interface, and for us on the CDT, allows us to leverage almost all of our existing gdb integration to provide an Eclipse UI interface.
JTAG debugging does have limitations. It’s not overly fast, especially when compared to native debugging. Stepping through code takes around a second in the setup I have. And with most configurations, the JTAG debugger hardly works at all once virtual memory is turned on in the CPU, making process level debugging, as you normally do with OS’s like Windows, Linux, QNX, etc, impossible. The biggest value of JTAG in the past has been for the initialization code that sets up the board and starts the operating system kernel. But that is starting to change though as JTAG debugger makers are figuring out how to do the virtual to physical and back translation and adding OS awareness in the debugger itself allowing for the full debug experience.
So I have the integration working now. With permission, I borrowed a lot of ideas from the Zylin Embedded CDT plug-in. Again, my hopes are to bring those guys and their customers on board to avoid the need for forking the CDT. It was pretty cool when I did my first debugger launch, and everything just worked. This is really the beauty of Eclipse and the CDT and the focus on extensibility, that makes adding new features a breeze.
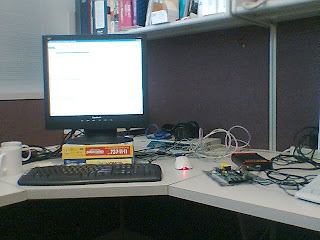
Below is a picture of my set-up. I have a little TI OMAP board hooked up to a Abatron BDI2000 JTAG device hooked up to a network hub that eventually hooks up to my laptop. You can’t see the screen, but trust me :), the CDT has reset the board, loaded in an image, started it up, and hit the breakpoint I had set. And you get all the CDT goodness like the variables, registers, and disassembly view. Tres cool!
My next step is to hook up qemu, the board emulator, with it’s built in gdb remote stub, which works just like a JTAG device, to this whole thing so you can try it out without having to fork out money for real hardware…
